<applet code="jschematic.class" codebase="classes" width=150 height=40>
<param name="SIM_SERVER" value="/cgi-bin/cgitest.cgi">
<param name="PRELOAD" value="../circuits/lowpass">
</applet>
<applet code="jschematic.class" archive="jschem.jar" width=150 height=40>
<param name="SIM_SERVER" value="/cgi-bin/cgitest.cgi">
<param name="PRELOAD" value="../circuits/lowpass">
</applet>
PARAMETERS:
The PRELOAD parameter allows to reference an existing datafile containing
graphical information for an circuit (*.gra files). When left away, WISE
opens an empty page.
Such a datafile can be generated with wise in an applet by copy and paste
via the clipboard into an external text editor (Menu: "Edit->VIEW code"),
as applets should not use in any case local file I/O due to security reasons,
or just by using jschematic as application locally (then a file menu appears
with load and save capability).
The SIM_SERVER parameter must be set for remote simulation. Alternatively,
a SPICE results data file (with suffix *.txt) may be referenced for demo
purposes. Without this parameter, simulation/demo mode is not possible!
Both parameters take relative URLS (then the current absolute codebase is added),
or simple absolute URLS (then the server/protocol is added) or complete URLs.
The "codebase" needs to point to the WISE java applet data installation. This may be centralized if more than one HTML page has WISE applets embedded. Same for the archive/jar approach - there the archive needs to be set. You find more about JAVA-HTML embedding on java.sun.com.
The Applet needs a JDK1.1 or higher capable broswer.

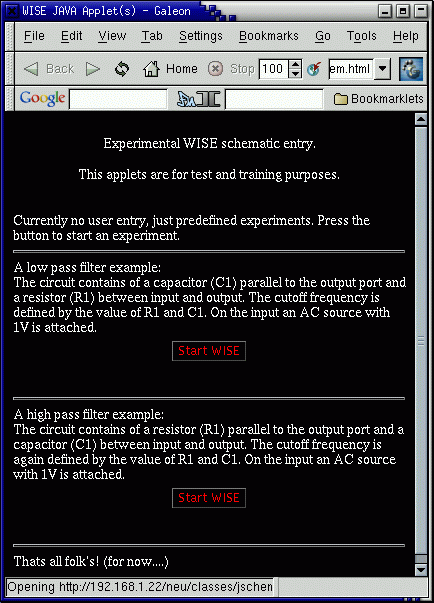
The button appears at the position where the applet is embedded. It
may be surrounded by descriptive text for the lab (and a secreenshot etc...)
When installed stand alone, it can be called without a browser:
CLASSPATH = <DIR-TO-WISE)/jschem.jar
java -Djschematic.sim_server='http://localhost/cgi-bin/cgitest.cgi' jschematic
PARAMETERS:
The jschematic.sim_server parameter has the same meaning as the SIM_SERVER applet parameter above.

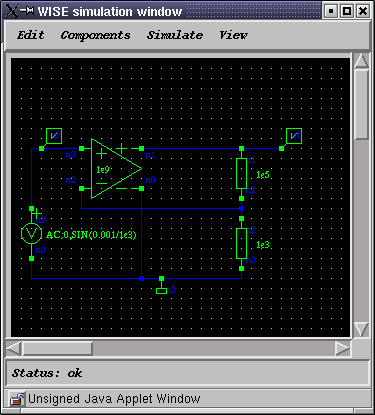
When WISE is started with a click on the button, a (optional) given preload schematic is loaded and the WISE schematic board appears. The Menu consists of three (four) major groups:


It is not allowed to drag segments over components. The wire is in such case red coloured and the element which is in the path is selected yellow to show the problem.
When the net is connected to a component pin, the pin changes from red to green and beside the pin the (generic) net name is shown. This allows to trace net connections of elements.
Clicking with the left button selects either a wire segment or a component for movement or deletion.
Double-clicking on a component opens the property menu of an element and allows a setup of parameters.
Double-clicking on a wire selects all segments belowing to the net.

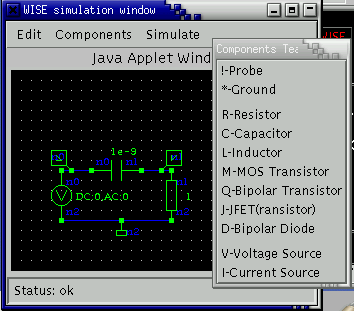
Selecting a component from the menu places a "ghost" element appears
on the board. It moves together with the mouse. A left-button click places
the component on its current position.

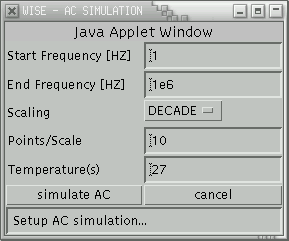
After setting up the values, the simulate button starts transferring the netlist to the server, the simulation is started and either an error window appears (containing the transcript of the spice solver) or the wave viewer is started to analyze the results graphically.

The upper part shows the graphical representation of the probes found in the circuit. By dragging the mouse (when the left button is pressed) the waveforms can be zoomed in and out. The 'fill' button returns instantly to the best fit of all waves.
The lower part shows the textual result. So it is possible to copy/paste the tables (with tabs between values) into other applications for post processing.